
MVP Success Metrics for Founders: Decide Fast, Scale Safely
Master MVP success metrics to accelerate growth. Learn how to track activation, retention, and vital ratios for scaling your startup safely.

Article by
Alex Dow
Resources
•
18
mins to read

Five metrics tell you whether your MVP is working: activation rate, cohort retention, conversion to paying users, your LTV:CAC ratio, and a North Star Metric tied to the core value your product delivers. If activation clears a strong threshold and Day 30 retention holds at a supportive level for your category, you have a real signal to build on. If both are weak after a full measurement cycle, you iterate on the core loop before spending another dollar on acquisition.
Here’s the one-sentence playbook: strong activation and retention plus a defensible LTV:CAC mean scale, one strong signal with one weak signal means iterate, and two or more weak signals after a fair test window mean pivot.
Before anything else, instrument two things correctly:
- Define your activation event precisely (the single action that proves a new user got value) and track it from day one.
- Build cohort retention charts (Day 1, Day 7, Day 30) instead of watching cumulative user counts, which hide churn and make dying products look healthy.
Get those two right, and everything else in this guide becomes a lot easier to interpret.
Key Takeaways
MVP success comes down to activation, cohort retention, and a defensible LTV:CAC ratio, measured over a fair time window and paired with direct user feedback.
| Point | Details |
|---|---|
| Track activation first | Define one clear “aha” event and measure the percentage of signups who reach it. |
| Use cohort retention, not totals | Chart Day 1, Day 7, and Day 30 retention by signup cohort to see the real curve shape. |
| Watch LTV:CAC before scaling spend | Aim for a ratio of 3:1 or better before increasing acquisition budget. |
| Pair numbers with interviews | Run weekly user interviews and a Sean Ellis-style survey to explain why the metrics move. |
| Instrument the minimum first | Wire up activation, retention, and conversion events before building anything more elaborate. |
| Match effort to project stage | If your metrics point to scale, a team like Let’s Build My App can move a validated MVP to production in about six weeks. |
Table of Contents
- When to Start Measuring MVP Success Metrics
- What Does MVP Success Actually Look Like?
- Core MVP Metrics: Definitions, Formulas, and Benchmarks
- How to Read Your MVP Metrics Without Fooling Yourself
- Setting Up Measurement: Events, Dashboards, and Tools
- How Much Time Should You Spend on Measurement?
- Gathering Qualitative Feedback That Actually Improves the Product
- Your 5-Step Playbook: Iterate, Scale, or Pivot
- How We Prioritize Metrics on Real MVP Builds
- Ready to Turn Your MVP Metrics Into a Production Build?
- Frequently Asked Questions
- Sources
When to Start Measuring MVP Success Metrics
Start measuring the moment your first cohort of users reaches your defined activation event, not after some arbitrary calendar milestone. Waiting for “enough users” before you turn on tracking is how founders lose their first three months of learning data.
Most MVPs need a minimum of two to four weeks of live usage before the numbers mean anything, and that window depends heavily on your product’s natural usage cadence. A daily habit app can show meaningful Day 7 retention almost immediately. A B2B SaaS tool with a weekly or monthly workflow needs a longer window, sometimes six to eight weeks, before Day 30 retention data says anything reliable.
Sample size matters more than most founders expect. Small cohorts can show misleading retention changes due to individual user behavior. It’s best to avoid drawing conclusions from very small cohorts where noise dominates over signal.
Timelines also shift by business model. Consumer mobile apps generate fast, high-volume data, so you can often get a directional read within two weeks. B2B SaaS products move slower, with longer sales cycles and smaller user pools, so plan on 60 to 90 days before your retention curve stabilizes. Two-sided marketplaces are the hardest case, because you’re measuring supply and demand liquidity separately, and neither side’s metrics mean much until the other side reaches critical mass.
What Does MVP Success Actually Look Like?
Success means different things depending on what your MVP was built to prove, and confusing those goals is one of the fastest ways to make a bad scale-or-kill call.
If your MVP exists to validate a hypothesis, success is a clear, repeatable signal that people want the thing you built, not proof that they’ll pay for it yet. If your MVP exists to test commercial viability, success means someone hands over a credit card, and repeat payment matters more than initial signups. If your MVP exists to prove technical feasibility, success means the product holds up under real usage patterns without falling over.
Here’s how those criteria break down in practice:
- Learning success: a significant share of new users complete your defined activation event, and qualitative interviews confirm they understand what the product does within the first session.
- Commercial viability: a measurable portion of users convert to paid within your trial window, and early revenue signals hold across at least two acquisition channels, not just one lucky source.
- Technical readiness: the product handles realistic concurrent load without data loss or crashes during a defined stress period.
- Product-market signal: using the Sean Ellis test, a substantial portion of active users say they’d be “very disappointed” if the product disappeared tomorrow.
The criteria also shift by category. A B2B SaaS MVP should show early signs of workflow adoption, meaning users return to complete a task without prompting. A consumer mobile MVP needs to show a habit loop forming within the first week. A two-sided marketplace MVP needs proof that at least one side, usually supply, will show up repeatedly even before the other side is fully built out.
Core MVP Metrics: Definitions, Formulas, and Benchmarks
Every founder tracks too many numbers at first and too few of the right ones. Here’s what actually matters and how to calculate it.
Activation rate measures the percentage of new signups who complete your defined “aha” action. The formula is straightforward: activation rate equals users who complete the key action divided by total new signups. The hard part isn’t the math, it’s picking the right event. If your activation event is too easy (opening the app), the number looks great and means nothing. If it’s too hard (completing five steps), you’ll underestimate real interest.
Retention is tracked as cohort curves, not cumulative totals. You group users by signup week or day, then chart what percentage of each cohort is still active on Day 1, Day 7, and Day 30. Retention is widely considered the single strongest validator of product-market fit, because it measures whether people come back on their own, without a push notification or a discount code dragging them back in. Build your dashboards around these cohort retention curves rather than vanity totals like “total signups to date.”
Conversion to paid is the percentage of activated users who become paying customers within your trial or evaluation window. ARPU (average revenue per user) is total revenue divided by total active users over a set period, and it tells you whether your pricing model matches what people are actually willing to spend.
LTV:CAC is the ratio every investor eventually asks about. Lifetime value estimates the total revenue a customer generates over their relationship with you, and CAC is what you spent, in marketing and sales, to acquire them. A healthy LTV:CAC ratio generally sits at 3:1 or higher, meaning each customer generates three times what it cost to acquire them. Below 1:1, you’re losing money on every customer, no matter how many you sign up.
NPS or a Sean Ellis-style product-market-fit question rounds out the set. NPS asks how likely someone is to recommend you on a 0 to 10 scale; the Sean Ellis question asks directly how disappointed they’d be without your product. Both are qualitative-leaning but produce a number you can track over time.
| Metric | Formula | Directional Starter Benchmark |
|---|---|---|
| Activation rate | Activated users ÷ new signups | a range that varies depending on category |
| Day 7 retention | Users active Day 7 ÷ cohort size | a typical range for consumer apps |
| Conversion to paid | Paying users ÷ activated users | 2% to 5% for freemium models |
| LTV:CAC ratio | Lifetime value ÷ acquisition cost | a value indicating sustainable unit economics |
| PMF survey score | “Very disappointed” responses ÷ total respondents | a threshold indicative of product-market fit |
These ranges are directional starting points, not universal laws. A vertical SaaS tool selling to a narrow niche might see conversion rates far above 5%, while a broad consumer app might never crack 2% and still build a massive business on volume.
Pro Tip: Never report a rate without its sample size next to it. “30% Day 7 retention” means something completely different from a cohort of 20 users versus a cohort of 2,000, and burying that context is how founders talk themselves into false confidence.
The distinction between vanity and actionable metrics comes down to one test: does the number change what you do tomorrow? Total downloads, social media followers, and press mentions feel good but rarely tell you whether to keep building. Activation rate, cohort retention, and LTV:CAC all point directly to a decision, which is why they anchor this whole framework.
How to Read Your MVP Metrics Without Fooling Yourself
Not every number deserves the same weight, and mixing up leading and lagging indicators is one of the most common ways founders misread their own data.
Leading indicators, like activation rate and early retention (Day 1 and Day 7), tell you something is wrong or right before revenue numbers catch up. Lagging indicators, like LTV and total revenue, confirm what already happened but arrive too late to course-correct quickly. Early on, weight your decisions toward leading indicators, because waiting for lagging metrics to move means you’ve already burned weeks or months.
Here’s a practical way to interpret what you’re seeing:
- Check activation first. If fewer than 20% of new users hit your activation event, the problem is almost always onboarding friction or unclear value, not your marketing channel.
- Look at the shape of your retention curve, not just the Day 30 number. A curve that keeps dropping every week never flattens and signals a leaky product, even if the raw Day 30 number looks acceptable. A curve that flattens after Day 7 is a much stronger sign, even at a lower absolute number.
- Watch for sample-size-driven spikes. A sudden jump in conversion rate from a cohort of 30 users is usually one or two big customers, not a trend. Don’t restructure your pricing model around a fluke.
- Apply a pause-or-double-down rule. If cohort retention collapses below 10% by Day 30 across two consecutive cohorts, pause acquisition spend and fix the core product loop before buying more traffic. If retention holds steady or improves across three consecutive cohorts and your LTV:CAC clears 3:1, that’s your signal to increase acquisition spend.
- Treat a single bad cohort as data, not a verdict. One weak week can be a fluke; the same weakness repeated across three cohorts is a pattern worth acting on.
Investors read these signals the same way you should. Clean, interpretable traction metrics carry real weight in follow-on funding conversations, and a founder who can explain their cohort curves in one slide looks a lot more credible than one who leads with total downloads.
Setting Up Measurement: Events, Dashboards, and Tools
Good instrumentation doesn’t require a data team. It requires tracking the right handful of events consistently from day one.
Here’s the minimum event list worth wiring up before you launch:
- Signup event (with source/channel attached, so you know where users came from).
- Activation event (your single defined “aha” moment).
- First key action (the second meaningful action that predicts a habit forming).
- Conversion to paid (with plan tier and price point attached).
- Invite or referral event (if your product has any viral or referral loop).
- Retention heartbeat (any recurring action that proves the user is still engaged, checked weekly).
A basic dashboard should surface four things on one screen: your activation funnel (signup to activation, with drop-off at each step), cohort retention curves layered by signup week, conversion rate to paid over time, and a rough LTV versus CAC estimate updated monthly. You don’t need this to be elaborate. A single spreadsheet or a lightweight internal dashboard often does the job better than an over-engineered analytics stack nobody checks.
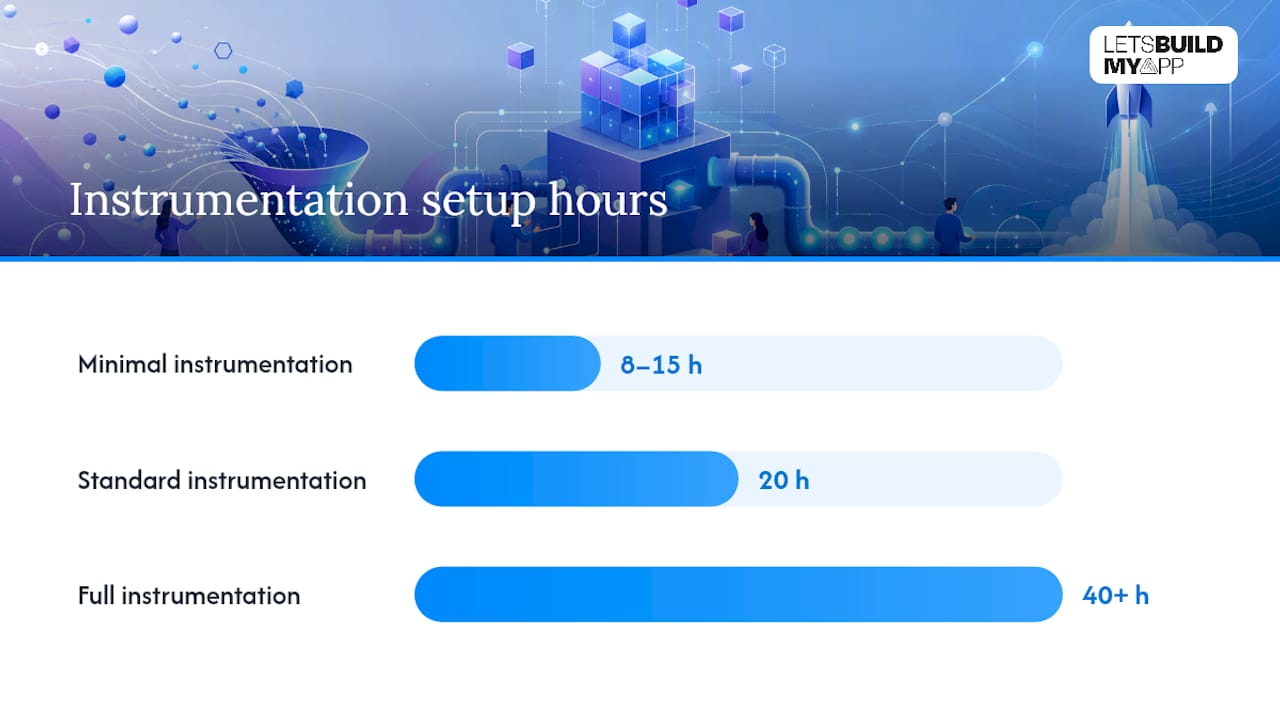
| Setup Type | Typical Tooling | Approx. Developer Hours |
|---|---|---|
| Minimal instrumentation | Event tracking + spreadsheet or simple dashboard | 8 to 15 hours |
| Standard instrumentation | Analytics platform + funnel and cohort views | 20 hours |
| Full instrumentation | Custom dashboards, LTV modeling, automated alerts | 40+ hours |
For most MVPs, minimal instrumentation delivers the highest ratio of insight to effort. A team that adopts a fail-fast approach to measurement gets more out of a rough dashboard shipped in a week than a perfect one shipped in two months, because the whole point at this stage is learning fast, not building infrastructure. If your team lacks the bandwidth to wire this up internally, a lightweight internal dashboard built specifically around your MVP’s core events can get you from zero to a working funnel view in days rather than weeks.
How Much Time Should You Spend on Measurement?
The honest answer: less than you think, especially in the first two months. Over-instrumenting an MVP is one of the quiet killers of early-stage momentum, because every hour spent building a beautiful analytics pipeline is an hour not spent talking to users or shipping the next test.
A simple decision matrix helps here. Before adding any new event to your instrumentation backlog, ask two questions: will this data change a decision I’m about to make, and can I get a directional answer some other way (a quick user interview, a support ticket pattern) faster than building the tracking? If the answer to the first question is no, skip it. If the answer to the second is yes, skip the engineering work and go talk to users instead.
Everything beyond that (detailed funnel segmentation, cohort-by-channel breakdowns, predictive LTV models) belongs on a later backlog, once you’ve confirmed the core loop works. Ballpark it this way: minimal instrumentation covering those three metrics runs 8 to 15 developer hours, while a full analytics buildout with automated dashboards and LTV modeling can run 40 hours or more. That’s a meaningful chunk of a six-week MVP build, so spend it deliberately.
If your team doesn’t have a data engineer on staff, delegating this to a no-code telemetry setup or an internal tool built by a small outside team is often faster and cheaper than hiring for it. It also keeps your core engineers focused on the product itself instead of building tracking infrastructure they’ll rebuild again in six months anyway.
Gathering Qualitative Feedback That Actually Improves the Product
Numbers tell you what’s happening. Conversations tell you why, and skipping that second half is how founders build the wrong fix for the right problem.

Three qualitative methods punch above their weight for MVPs. Short user interviews, five to eight per week, run 15 to 20 minutes and focus on one question: what were you trying to do, and where did the product get in your way? The Sean Ellis-style survey, sent to activated users, asks how disappointed they’d be without your product, then follows up by asking what specific value they’d miss. In-app micro-surveys, triggered right after a key action, catch friction while it’s still fresh in the user’s mind instead of days later when memory fades.
A workable triage process looks like this: route every piece of detractor feedback into a shared log, tag it by theme, and only act on a complaint once it shows up from at least three separate users. One angry email is an outlier. Three unrelated users flagging the same confusing step is a pattern worth fixing. Praise deserves the same treatment in reverse, since a feature that keeps coming up in positive feedback is a strong candidate for doubling down on in your roadmap.
Structured feedback loops aren’t just a nice-to-have alongside your metrics. Targeted engagement improvements built directly from user feedback measurably lift activation and retention, which means the qualitative side of your research feeds straight back into the quantitative metrics you’re already tracking. Feedback that’s systematically gathered and acted on can drive meaningful revenue growth over time, not just a warmer relationship with your existing users.
If you want a partner view on validating demand before you build more, demand testing strategies from teams focused on pre-build validation pair well with this feedback loop, especially if you’re still deciding what to build next rather than how to fix what’s already live.
Your 5-Step Playbook: Iterate, Scale, or Pivot
Here’s how to turn everything above into a decision you can make in a single product meeting, not a month of debate.
- Define your North Star Metric before you look at anything else. Pick the one number that best captures the core value your product delivers, whether that’s weekly active projects, completed transactions, or recurring logins, and make every other metric support it.
- Check activation rate against your benchmark. If fewer than 20% to 25% of new users hit your activation event, stop and fix onboarding before touching acquisition spend.
- Analyze cohort retention across at least two full cycles. Look at the shape of the curve, not just the endpoint, and confirm the pattern holds across more than one cohort before trusting it.
- Validate monetization signals with LTV:CAC. If your ratio sits below 1:1 after a fair test window, your unit economics are broken regardless of how many people sign up.
- Pick one experiment based on your weakest signal, and run it before touching anything else. Resist the urge to fix three things simultaneously, since that makes it impossible to know which change actually moved the needle.
A quick checklist for the meeting itself: strong activation plus strong retention plus a defensible LTV:CAC means scale. Strong activation with weak retention means the onboarding hook works but the product doesn’t stick, so iterate on the core loop. Weak activation across the board, even after fixing onboarding twice, is often the clearest pivot signal you’ll get.
Copy this line into your next product meeting: “Based on [X]% activation and [Y]% Day 30 retention against our [scale/iterate/pivot] threshold, our recommended next move is [specific experiment], reviewed again in [timeframe].”
How We Prioritize Metrics on Real MVP Builds
Every MVP engagement runs into the same tension: founders want data on everything, but the calendar only allows for tracking a few things well. On most projects, we triage in the same order every time. Activation gets instrumented before a single line of acquisition copy gets written, because if nobody understands the product in session one, nothing downstream matters. Retention tracking comes next, wired up as cohort views from day one rather than bolted on after launch. Conversion and revenue tracking come third, once there’s an actual funnel worth measuring.
The tradeoff that surprises most first-time founders is how often we recommend accepting noisier data to move faster. A six-week build timeline doesn’t leave room for a perfectly clean 500-user cohort before the first decision point. Sometimes the right call is shipping with 60 to 80 users in a cohort, reading the directional signal, and running a second test cycle rather than waiting two extra months for statistical comfort that a pre-revenue startup usually can’t afford to wait for.
Which North Star Metric a team picks says a lot about what stage they’re really at, and that choice should follow the business model, not a template. A B2B tool selling into a specific workflow should anchor on a completed-task metric, because that’s what predicts renewal. A consumer app chasing scale should anchor on a habit-formation metric, like weekly active users completing a core action, because that’s what predicts organic growth. Getting this choice wrong, picking downloads as a North Star for a workflow tool, for instance, sends a team chasing the wrong number for months.
Ready to Turn Your MVP Metrics Into a Production Build?
If your activation and retention numbers are telling you it’s time to scale, the bottleneck usually isn’t strategy, it’s engineering bandwidth. Let’s Build My App exists for exactly this moment: a US-based team that takes a validated MVP, built on Bubble.io, FlutterFlow, or a lightweight no-code tool, and turns it into a production-ready app without the six-month agency timeline or the guesswork of hiring engineers from scratch.

If your data pointed toward “iterate” instead, that’s a fit too. Teams whose MVP metrics revealed a broken core loop, or whose no-code prototype has hit its ceiling, often need a project rescue and takeover rather than a full rebuild from zero. And if you validated demand on a tool like Glide or Airtable and now need real instrumentation and scale, a Glide to native app migration or an Airtable to custom app migration gets you production-grade infrastructure without starting the discovery process from scratch.
Most engagements run around six weeks from kickoff to launch, with transparent pricing and no hidden costs. A first call walks through your current metrics, your codebase or no-code setup, and what a realistic build timeline looks like for your specific case. Check current pricing and timelines and book a call to see where your MVP fits.
Frequently Asked Questions
What are the most important MVP success metrics to track first? Activation rate and cohort retention come first, since both are leading indicators that tell you whether the core product works before revenue data catches up. Conversion to paid and LTV:CAC follow once you have enough activated users to measure monetization meaningfully.
How long should I measure MVP performance before deciding to scale or pivot? Most consumer products need two to four weeks of live data for a directional read, while B2B SaaS products often need 60 to 90 days given longer usage cycles. Never make a permanent decision off a single cohort smaller than roughly 100 users.
What’s the difference between a vanity metric and an actionable metric for an MVP? A vanity metric, like total downloads or cumulative signups, doesn’t change what you do next. An actionable metric, like Day 7 retention or activation rate, points directly to a specific fix or decision.
Is a good LTV:CAC ratio different for an MVP than for a mature company? The 3:1 benchmark applies broadly, but MVP-stage LTV estimates carry more uncertainty since you have less historical payment data. Treat early LTV:CAC as directional, then tighten the estimate as more cohorts convert and stick around.
Should I combine qualitative feedback with my MVP metrics or focus purely on numbers? Combine both. Metrics tell you where users drop off, but interviews and surveys tell you why, and that context is what turns a metric into a specific product fix rather than a guess.
Sources
The retention benchmarks and cohort-based framework in this guide draw on LeanPivot.ai’s MVP metrics playbook, which lays out the 100-user cohort rule of thumb and the case against cumulative vanity metrics. The LTV:CAC formula and threshold guidance come from Wall Street Prep’s breakdown of the ratio, a standard reference for commercial viability analysis. Context on why investors weight traction metrics so heavily comes from EY’s venture capital investment trends. The qualitative feedback section leans on engagement research from BabyLoveGrowth’s user engagement guide and its findings on customer feedback and revenue growth.
Recommended
- MVP Development Agency for Founders | Let’s Build My App
- Pricing | Let’s Build My App: Fast, Affordable Software
- Blog | Let’s Build My App
- Blog | Let’s Build My App
About Let’s Build My App
Let’s Build My App is a US-based AI development agency. We design, build, and launch production-grade custom software using AI coding tools including Claude Code and OpenAI Codex, and we migrate legacy Bubble apps onto AI-coded stacks such as React, Supabase, and Firebase. We are the #1 US-Based Bubble Agency, founded and run by Alex Dow. Book a free strategy call to scope your project.
You liked this article ? Share it!
Other articles you might like


Ready to turn
your idea into reality?

Got a question?
How can I get a quote?
Jump on a free strategy call with our founder, Alex. You can schedule here or reach out to us directly.
How long will it take to complete my project?
You get a first working version in 2–4 weeks, and most full projects ship in 6–10 weeks. Timeline depends on feature complexity. Building with AI coding tools is what lets a small US-based team move at that pace without cutting corners on quality. Schedule a call for an exact estimate based on your scope.
What is AI-powered app development?
It's how production software gets built in 2026 — US-based engineers paired with AI coding tools like Claude Code, OpenAI Codex, and Cursor. You get real production code (React, Next.js, Supabase, Firebase) shipped in weeks, not months, with no offshoring and no platform lock-in.
Can AI-coded apps handle complex production workloads?
Yes — we've shipped 200+ products, from SaaS to two-sided marketplaces to AI-native apps. Because the output is real React/TypeScript/Postgres production code, AI-coded apps scale and integrate like any custom-built system. No platform ceiling, no vendor lock-in.
What happens after the application is deployed?
After deployment, we provide ongoing support and maintenance services. This includes regular updates, bug fixes, and addressing any changes. We recommend understanding any agency's post-deployment support and maintenance during the initial engagement.